
Informations sur le stock Wolters Kluwer | Filter Basic-Info
Action: Wolters Kluwer (NL Amsterdam 25), ISIN: NL0000395903
| Last price | 71.78 | Cours maximal | 114.10 |
| Cours minimal | 55.82 | Retour sur 1 année | -35.85 |
| Objectif moyen | 106.75 | Retour attendu | 48.72 % |
| Secteur | Services Informatique | Sous-secteur | Éditeurs |
| Vendre | 0 | Notations |

|
| Retenu | 1 | Consensus |
 
|
| Acheter | 3 | ||
| Rapport annuels 2018 |
Informations de contact:Rue: ZuidpoolsingelCode Zip: 2400 BA AlBoîte postale: P.O. Box 1030Ville: ZuidpoolsingelPays: Pays-BasTéléphone: 31 (0) 172 641 Email: ir@wolterskluwer.comWebsite: www.wolterskluwer.com
Analyse du secteur Wolters Kluwer
| Année | Chiffre d'affaires | Total du secteur | Part de marché |
|---|---|---|---|
| 2019 | 4,612 | 505,112 | 0.91 % |
| 2020 | 4,603 | 495,407 | 0.93 % |
| 2021 | 4,771 | 660,424 | 0.72 % |
| 2022 | 5,453 | 729,718 | 0.75 % |
| 2023 | 5,584 | 747,686 | 0.75 % |
Conseil Wolters Kluwer
News Wolters Kluwer
No Records Found
Rapports annuels Wolters Kluwer
| 2017 | 2018 | 2019 | 2020 | 2021 |
|---|---|---|---|---|
Profile Wolters Kluwer
|
||||||||||||||||||
| ||||||||||||||||||
|
Aegon Den Haag |
Waarderingen en dividenden aandeel Aegon_aandeel_koers.png

Het Nederlandse bedrijf keerde de voorbije vijf jaar dividenden uit. . Gemeten vanaf 2015 was het doorsnee dividendrendement 3,6 procent.
We kunnen zeggen dat op basis van haar historische dividenden en koers/winst-verhoudingen dat het het Nederlandse bedrijf aandeel een dividendloos waardeaandeel genoemd kan worden. De totale inkomsten van de verzekeraar tussen 2015 en 2019 waren zeer fluctuerend en bewogen tussen de 34,96 miljard euro en 67,49 miljard euro. Over de laatste jaren bewoog het nettoresultaat van de verzekeraar tussen de 453 miljoen en de 1,4 miljard euro. Het Nederlandse bedrijf had eind 2019 circa 2,03 miljard aandelen uitstaan. Midden 2020 was Aegon op de beurs rond de 8,3 miljard euro waard. Het aandeel noemen we zodoende een large cap.
Aegon's balans bestaat vooral uit vreemd vermogen
Per eind 2019 bedroeg de verzekeraar's balanstotaal circa 441,12 miljard euro. Vorig jaar bedroeg de totale schuld van de verzekeraar 416,1 miljard euro. Dit komt overeen met 94 procent van de totale balans. Het aandeel verloor dit jaar ruim 37 procent.
Rendementen aandeel Aegon
Aegon_aandeel_koers.png
Dit jaar slecht beleggingsjaar voor beleggers in Aegon
Over de afgelopen 5 jaar verloor het aandeel gigantisch. De verzekeraarssector staat sinds 2010 97 procent hoger. Sinds 2015 staat de sector 22 procent hoger en over de voorbije 12 maanden (december 2015-december 2016) 97 procent verlies.
In tegenstelling tot wat algemeen aangenomen wordt is Lorem Ipsum niet zomaar willekeurige tekst. het heeft zijn wortels in een stuk klassieke latijnse literatuur uit 45 v.Chr. en is dus meer dan 2000 jaar oud. Richard McClintock, een professor latijn aan de Hampden-Sydney College in Virginia, heeft één van de meer obscure latijnse woorden, consectetur, uit een Lorem Ipsum passage opgezocht, en heeft tijdens het zoeken naar het woord in de klassieke literatuur de onverdachte bron ontdekt. Lorem Ipsum komt uit de secties 1.10.32 en 1.10.33 van "de Finibus Bonorum et Malorum" (De uitersten van goed en kwaad) door Cicero, geschreven in 45 v.Chr. Dit boek is een verhandeling over de theorie der ethiek, erg populair tijdens de renaissance. De eerste regel van Lorem Ipsum, "Lorem ipsum dolor sit amet..", komt uit een zin in sectie 1.10.32.
In tegenstelling tot wat algemeen aangenomen wordt is Lorem Ipsum niet zomaar willekeurige tekst. het heeft zijn wortels in een stuk klassieke latijnse literatuur uit 45 v.Chr. en is dus meer dan 2000 jaar oud. Richard McClintock, een professor latijn aan de Hampden-Sydney College in Virginia, heeft één van de meer obscure latijnse woorden, consectetur, uit een Lorem Ipsum passage opgezocht, en heeft tijdens het zoeken naar het woord in de klassieke literatuur de onverdachte bron ontdekt. Lorem Ipsum komt uit de secties 1.10.32 en 1.10.33 van "de Finibus Bonorum et Malorum" (De uitersten van goed en kwaad) door Cicero, geschreven in 45 v.Chr. Dit boek is een verhandeling over de theorie der ethiek, erg populair tijdens de renaissance. De eerste regel van Lorem Ipsum, "Lorem ipsum dolor sit amet..", komt uit een zin in sectie 1.10.32.
In tegenstelling tot wat algemeen aangenomen wordt is Lorem Ipsum niet zomaar willekeurige tekst. het heeft zijn wortels in een stuk klassieke latijnse literatuur uit 45 v.Chr. en is dus meer dan 2000 jaar oud. Richard McClintock, een professor latijn aan de Hampden-Sydney College in Virginia, heeft één van de meer obscure latijnse woorden, consectetur, uit een Lorem Ipsum passage opgezocht, en heeft tijdens het zoeken naar het woord in de klassieke literatuur de onverdachte bron ontdekt. Lorem Ipsum komt uit de secties 1.10.32 en 1.10.33 van "de Finibus Bonorum et Malorum" (De uitersten van goed en kwaad) door Cicero, geschreven in 45 v.Chr. Dit boek is een verhandeling over de theorie der ethiek, erg populair tijdens de renaissance. De eerste regel van Lorem Ipsum, "Lorem ipsum dolor sit amet..", komt uit een zin in sectie 1.10.32.
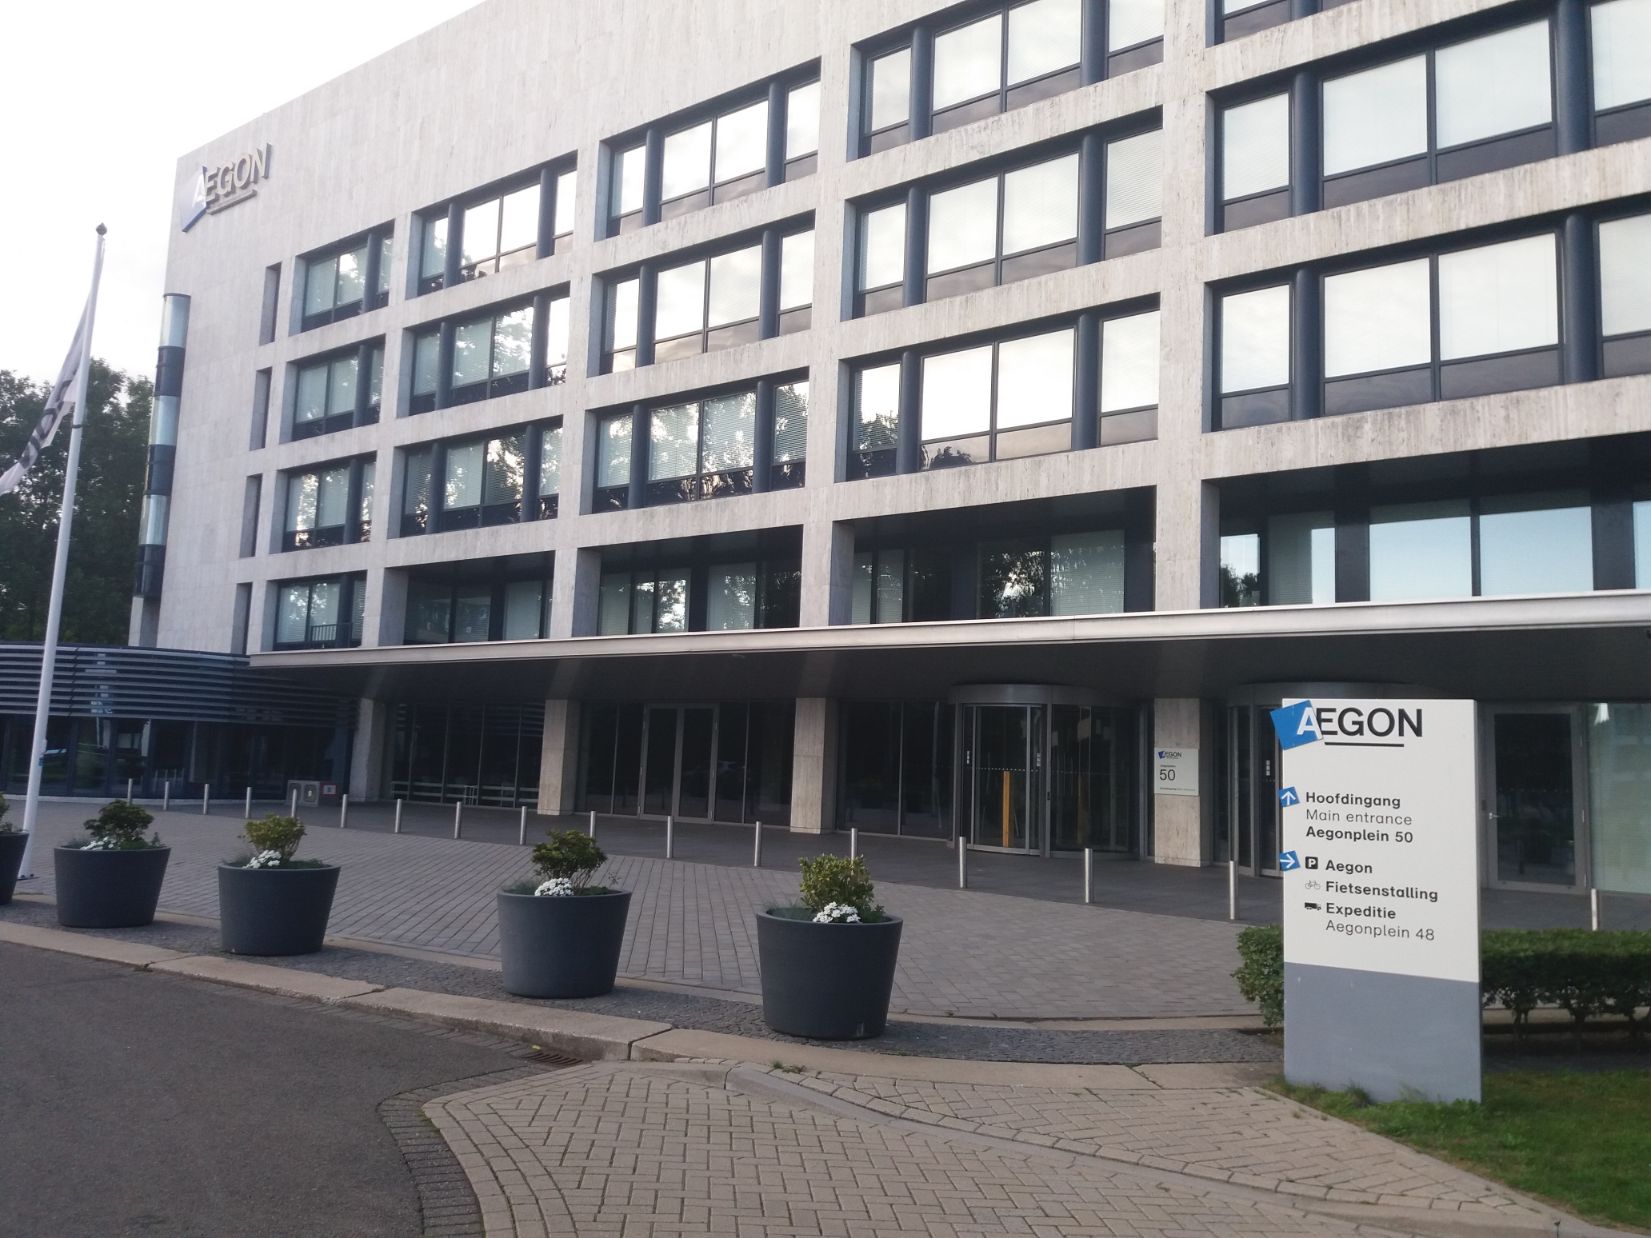
Aegon hoofdkantoor Den Haag |
In tegenstelling tot wat algemeen aangenomen wordt is Lorem Ipsum niet zomaar willekeurige tekst. het heeft zijn wortels in een stuk klassieke latijnse literatuur uit 45 v.Chr. en is dus meer dan 2000 jaar oud. Richard McClintock, een professor latijn aan de Hampden-Sydney College in Virginia, heeft één van de meer obscure latijnse woorden, consectetur, uit een Lorem Ipsum passage opgezocht, en heeft tijdens het zoeken naar het woord in de klassieke literatuur de onverdachte bron ontdekt. Lorem Ipsum komt uit de secties 1.10.32 en 1.10.33 van "de Finibus Bonorum et Malorum" (De uitersten van goed en kwaad) door Cicero, geschreven in 45 v.Chr. Dit boek is een verhandeling over de theorie der ethiek, erg populair tijdens de renaissance. De eerste regel van Lorem Ipsum, "Lorem ipsum dolor sit amet..", komt uit een zin in sectie 1.10.32.
In tegenstelling tot wat algemeen aangenomen wordt is Lorem Ipsum niet zomaar willekeurige tekst. het heeft zijn wortels in een stuk klassieke latijnse literatuur uit 45 v.Chr. en is dus meer dan 2000 jaar oud. Richard McClintock, een professor latijn aan de Hampden-Sydney College in Virginia, heeft één van de meer obscure latijnse woorden, consectetur, uit een Lorem Ipsum passage opgezocht, en heeft tijdens het zoeken naar het woord in de klassieke literatuur de onverdachte bron ontdekt. Lorem Ipsum komt uit de secties 1.10.32 en 1.10.33 van "de Finibus Bonorum et Malorum" (De uitersten van goed en kwaad) door Cicero, geschreven in 45 v.Chr. Dit boek is een verhandeling over de theorie der ethiek, erg populair tijdens de renaissance. De eerste regel van Lorem Ipsum, "Lorem ipsum dolor sit amet..", komt uit een zin in sectie 1.10.32.
In tegenstelling tot wat algemeen aangenomen wordt is Lorem Ipsum niet zomaar willekeurige tekst. het heeft zijn wortels in een stuk klassieke latijnse literatuur uit 45 v.Chr. en is dus meer dan 2000 jaar oud. Richard McClintock, een professor latijn aan de Hampden-Sydney College in Virginia, heeft één van de meer obscure latijnse woorden, consectetur, uit een Lorem Ipsum passage opgezocht, en heeft tijdens het zoeken naar het woord in de klassieke literatuur de onverdachte bron ontdekt. Lorem Ipsum komt uit de secties 1.10.32 en 1.10.33 van "de Finibus Bonorum et Malorum" (De uitersten van goed en kwaad) door Cicero, geschreven in 45 v.Chr. Dit boek is een verhandeling over de theorie der ethiek, erg populair tijdens de renaissance. De eerste regel van Lorem Ipsum, "Lorem ipsum dolor sit amet..", komt uit een zin in sectie 1.10.32.
Results Wolters Kluwer
| Résultats |
2021
|
2022
|
2023
|
2024
|
2025
|
|---|---|---|---|---|---|
| Revenu |
|
|
|
|
|
| Coûts |
|
|
|
|
|
| Profit |
|
|
|
|
|
| Marge de profit |
|
|
|
|
|
| ROI |
|
|
|
|
|
Bilan Wolters Kluwer
| Bilan |
2021
|
2022
|
2023
|
2024
|
2025
|
|---|---|---|---|---|---|
| Capitaux propres du groupe |
|
|
|
|
|
| Total des passifs |
|
|
|
|
|
| Total des actifs |
|
|
|
|
|
| Solvabilité |
|
|
|
|
|
| Trésorerie |
|
|
|
|
|
| Cash flow |
|
|
|
|
|
| Employés |
|
|
|
|
|
| revenue per employee |
|
|
|
|
|
| flux de trésorerie / total des actifs |
|
|
|
|
|
Details Wolters Kluwer
| Details |
2016
|
2017
|
2018
|
2019
|
2020
|
|---|---|---|---|---|---|
| Cours |
34.42
|
43.48
|
51.66
|
65.02
|
69.06
|
| Eps |
1.66
|
2.21
|
2.35
|
2.46
|
2.70
|
| Price/earnings-ratio |
20.73
|
19.67
|
21.98
|
26.43
|
26.59
|
| Dividend |
0.67
|
0.72
|
0.83
|
1.00
|
1.16
|
| % de dividendes |
1.95 %
|
1.66 %
|
1.61 %
|
1.54 %
|
1.62 %
|
| % de distribution |
0.40
|
0.33
|
0.35
|
0.41
|
0.43
|
| valeur comptable |
9.11
|
7.92
|
8.31
|
8.93
|
7.95
|
| Cours / valeur comptable |
0.26
|
0.18
|
0.16
|
0.14
|
0.11
|
| flux de trésorerie par action |
3.22
|
3.34
|
3.44
|
4.13
|
4.56
|
| Actions |
288
|
281
|
271
|
267
|
262
|
| valeur de marché |
9.902,60
|
12.233,57
|
14.008,33
|
17.337,91
|
18.838,23
|
Details Wolters Kluwer
Price Info Wolters Kluwer
|
Date
|
Cours
|
|---|---|
|
09 oct. 2026
|
71.78
|
|
08 oct. 2026
|
70.90
|
|
06 oct. 2026
|
68.32
|
|
17 sept. 2026
|
68.84
|
|
15 sept. 2026
|
70.72
|
|
14 sept. 2026
|
66.24
|
|
28 août 2026
|
70.12
|
|
11 août 2026
|
70.42
|
|
07 août 2026
|
69.62
|
|
06 août 2026
|
70.24
|
|
28 juil. 2026
|
67.36
|
|
14 juil. 2026
|
62.44
|
|
10 juil. 2026
|
60.50
|
|
09 juil. 2026
|
59.92
|
|
08 juil. 2026
|
59.02
|
|
07 juil. 2026
|
60.18
|
|
06 juil. 2026
|
57.88
|
|
03 juil. 2026
|
57.62
|
|
02 juil. 2026
|
57.58
|
|
01 juil. 2026
|
57.20
|
|
30 juin 2026
|
56.44
|
|
29 juin 2026
|
56.86
|
|
26 juin 2026
|
57.00
|
|
25 juin 2026
|
55.82
|
|
24 juin 2026
|
56.26
|
|
23 juin 2026
|
56.74
|
|
22 juin 2026
|
56.54
|
|
19 juin 2026
|
58.86
|
|
18 juin 2026
|
58.20
|
|
17 juin 2026
|
59.80
|

