
Informations sur le stock Aegon | Filter Basic-Info
Action: Aegon (NL Amsterdam 25), ISIN: NL0000303709
| Last price | 7.50 | Cours maximal | 8.29 |
| Cours minimal | 5.96 | Retour sur 1 année | 60.60 |
| Objectif moyen | 8.16 | Retour attendu | 8.83 % |
| Secteur | Financiers | Sous-secteur | Assurance |
| Vendre | 0 | Notations |
 
|
| Retenu | 2 | Consensus |
 
|
| Acheter | 2 | ||
| Rapport annuels 2019 |
Lorem Ipsum is simply dummy text of the printing and typesetting industry. Lorem Ipsum has been the industry's standard dummy text ever since the 1500s, when an unknown printer took a galley of type and scrambled it to make a type specimen book. It has survived not only five centuries, but also the leap into electronic typesetting, remaining essentially unchanged. It was popularised in the 1960s with the release of Letraset sheets containing Lorem Ipsum passages, and more recently with desktop publishing software like Aldus PageMaker including versions of Lorem Ipsum.
AEGON
AEGON N.V was formed in the year 1983 as a multinational life insurance, asset and pension management organization. The company is currently based in The Hague Netherlands and was founded after the merger of AGO Holding N.V and Ennia N.V. After this combination, AEGON bought Scottish equitable in 1994 and later established Stonebridge International Insurance Limited with an aim of developing and marketing a wide range of insurance products such as health, unemployment and accidents cover. More acquisitions were made in 1999 when AEGON took the life insurance business that previously belonged to Guardian Royal Exchange, It was also able to buy Transamerica Corporation in the same year.
By the end of December 2017 AEGON had grown its labor force to about 28 300 employees all over the world to facilitate service delivery to its clients. AEGON business majorly focuses on assets and savings managements, pension and insurance. The company also performs banking activities and its insurance covers accidents, health insurance, and general insurance and supplemental health.
Most AEGON operations are centered in the United States, Netherlands and United Kingdom, also worth noting is that AEGON is a constituent company of AEX index with a primary and secondary listing in Euronext Amsterdam and New York Stock Exchange respectively.
Analyse du secteur Aegon
| Year | Turnover | Total sector | Market share |
|---|---|---|---|
| 2019 | 0 | 26,036 | 0.00 % |
| 2020 | 0 | 22,641 | 0.00 % |
| 2021 | 0 | 23,593 | 0.00 % |
| 2022 | 0 | 24,160 | 0.00 % |
| 2023 | 0 | 30,232 | 0.00 % |
Conseil Aegon
News Aegon
No Records Found
Rapports annuels Aegon
| 2017 | 2018 | 2019 | 2020 | 2021 |
|---|---|---|---|---|
Profile Aegon
|
||||||||||||||||||
|
||||||||||||||||||
|


Aegon, Aegonplein Den Haag |
Hier vermelden we de belangrijkste zaken van het aandeel Aegon. Aegon is een Nederlandse verzekeraar. Andere spelers in de sector zijn onder andere Banvida, Gjensidige, Chubb Corp. . en Adamjee Insurance Company. Het bedrijf opeert vanuit haar hoofdkantoor in Den Haag.
Eind 2019 werkten er circa 24 duizend voor het bedrijf. Al Aegon's jaarverslagen bevinden zich hier. Midden 2020 werd het aandeel van de verzekeraar verhandeld met een koers/winst-verhouding van 4. De waarde van het aandeel was dus 4 keer de WPA van 2019.
Waarderingen en dividenden aandeel Aegon

|
Het Nederlandse bedrijf keerde de voorbije vijf jaar dividenden uit. . Gemeten vanaf 2015 was het doorsnee dividendrendement 3,6 procent.
Op basis van het afwezige dividend en de koers/winst-verhouding kunnen we het aandeel als een dividendloos waardeaandeel typeren.
|
Aegon, Nederland Den Haag |
Aegon's totale inkomsten tussen 2015 en 2019 waren behoorlijk volatiel en bewogen tussen de 34,96 miljard euro en 67,49 miljard euro. Over de laatste jaren bewoog het nettoresultaat van de verzekeraar tussen de 453 miljoen en de 1,4 miljard euro. Het Nederlandse bedrijf had eind 2019 circa 2,03 miljard aandelen uitstaan. Midden 2020 was Aegon op de beurs rond de 8,3 miljard euro waard. Het aandeel noemen we zodoende een large cap.
Aegon's balans bestaat vooral uit vreemd vermogen
Per eind 2019 bedroeg de verzekeraar's balanstotaal circa 441,12 miljard euro. Vorig jaar bedroeg de totale schuld van de verzekeraar 416,1 miljard euro. Dit komt overeen met 94 procent van de totale balans. Het aandeel verloor dit jaar ruim 37 procent.
Dit jaar slecht beleggingsjaar voor beleggers in Aegon
Rendementen aandeel Aegon
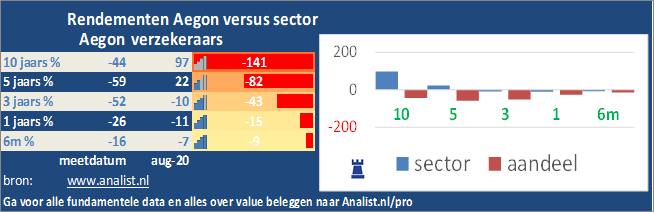
Aegon_aandeel_koersgrafiek.pngOver de afgelopen 5 jaar verloor het aandeel gigantisch. De verzekeraarssector staat sinds 2010 97 procent hoger. Sinds 2015 staat de sector 22 procent hoger en over de voorbije 12 maanden (december 2015-december 2016) 97 procent verlies.
Waarderingen en dividenden aandeel Aegon
 |
 |
Results Aegon
| Résultats |
2021
|
2022
|
2023
|
2024
|
2025
|
|---|---|---|---|---|---|
| Revenu |
|
|
|
|
|
| Coûts |
|
|
|
|
|
| Profit |
|
|
|
|
|
| Marge de profit |
|
|
|
|
|
| ROI |
|
|
|
|
|
Bilan Aegon
| Bilan |
2021
|
2022
|
2023
|
2024
|
2025
|
|---|---|---|---|---|---|
| Capitaux propres du groupe |
|
|
|
|
|
| Total des passifs |
|
|
|
|
|
| Total des actifs |
|
|
|
|
|
| Solvabilité |
|
|
|
|
|
| Trésorerie |
|
|
|
|
|
| Cash flow |
|
|
|
|
|
| Employés |
|
|
|
|
|
| revenue per employee |
|
|
|
|
|
| flux de trésorerie / total des actifs |
|
|
|
|
|
Details Aegon
| Details |
2016
|
2017
|
2018
|
2019
|
2020
|
|---|---|---|---|---|---|
| Cours |
5.23
|
5.32
|
4.08
|
4.07
|
3.24
|
| Eps |
0.22
|
1.08
|
0.31
|
0.70
|
|
| Price/earnings-ratio |
23.77
|
4.93
|
13.16
|
5.81
|
|
| Dividend |
0.22
|
0.23
|
0.25
|
0.13
|
0.10
|
| % de dividendes |
4.21 %
|
4.32 %
|
6.13 %
|
3.19 %
|
1.33 %
|
| % de distribution |
1.00
|
0.21
|
0.81
|
0.19
|
|
| valeur comptable |
12.20
|
12.00
|
11.23
|
12.31
|
12.42
|
| Cours / valeur comptable |
2.33
|
2.26
|
2.75
|
3.03
|
1.66
|
| flux de trésorerie par action |
1.64
|
0.27
|
0.25
|
3.59
|
-1.40
|
| Actions |
2,026
|
2,030
|
2,033
|
2,032
|
2,044
|
| valeur de marché |
10.594,77
|
10.799,59
|
8.295,01
|
8.269,18
|
15.332,78
|
Details Aegon
Price Info Aegon
|
Date
|
Cours
|
|---|---|
|
13 oct. 2026
|
7.50
|
|
09 oct. 2026
|
7.39
|
|
08 oct. 2026
|
7.50
|
|
06 oct. 2026
|
7.62
|
|
17 sept. 2026
|
7.94
|
|
15 sept. 2026
|
7.86
|
|
14 sept. 2026
|
7.90
|
|
28 août 2026
|
7.89
|
|
11 août 2026
|
8.29
|
|
07 août 2026
|
8.26
|
|
06 août 2026
|
8.23
|
|
28 juil. 2026
|
8.08
|
|
14 juil. 2026
|
7.70
|
|
10 juil. 2026
|
7.70
|
|
09 juil. 2026
|
7.70
|
|
08 juil. 2026
|
7.66
|
|
07 juil. 2026
|
7.71
|
|
06 juil. 2026
|
7.73
|
|
03 juil. 2026
|
7.67
|
|
02 juil. 2026
|
7.61
|
|
01 juil. 2026
|
7.58
|
|
30 juin 2026
|
7.44
|
|
29 juin 2026
|
7.39
|
|
26 juin 2026
|
7.45
|
|
25 juin 2026
|
7.42
|
|
24 juin 2026
|
7.43
|
|
23 juin 2026
|
7.55
|
|
22 juin 2026
|
7.55
|
|
19 juin 2026
|
7.44
|
|
18 juin 2026
|
7.39
|

